.webp)


Trade with a Top ECN Forex Broker

Earn $7/Lot
Platform


Trade Cryptocurrencies with xtrememarkets

Xtreme Markets
Most Trusted Broker

Start a Journey of Financial Success

Reliable Powerful and Flexible Raw Spreads from 0.0 pips 

Trade With Best ECN Forex Broker
- Ultra Fast Order Execution
- 24/5 Excellent Customer Support
- Segregated Client Accounts
- Deep Pool Liquidity
- Forex Education & Market Analysis
PARTNER WITH BEST FOREX BROKER

Earn unlimited commissions and build your own affiliate business as one of our partners!
Achieve your goals with exceptional support and marketing tools.
Benefit from Forex Market potential and our unique Partnership programs
Enjoy high commissions and continuous support to grow your business
best patekphilippe on the for the consistent expansion.
COPY TRADES WITH XTREME MARKETS
Most Convenient
and Simplest Way to Trade Forex
Xtreme Markets Copy Trading Program offers the opportunity to automatically copy trades of successful traders so that you do not have to spend many hours developing your own strategy. Join the Copy Trading program now and let the selected professionals work for you!

Security of Funds

Risk
Management

Leading
Financial Safety

Accounts with
major banks

Segregated
Accounts

Negative Balance
Protection
TRADING ACCOUNT TYPES
TRADING ACCOUNT TYPES

 Micro
Micro
- Leverage upto 1:1000
- Spreads from 1 Pips
- Account Manager
- Bonus Offerings
- Expert Advisor
- Minimum Deposit $5
 STANDARD
- Leverage upto 1:500
- Spreads from 1 Pips
- Account Manager
- Bonus Offerings
- Expert Advisor
- Minimum Deposit $250

ECN
- Leverage upto 1:400
- Spreads from 0 Pips
- Account Manager
- Bonus Offerings
- Expert Advisor
- Minimum Deposit $250
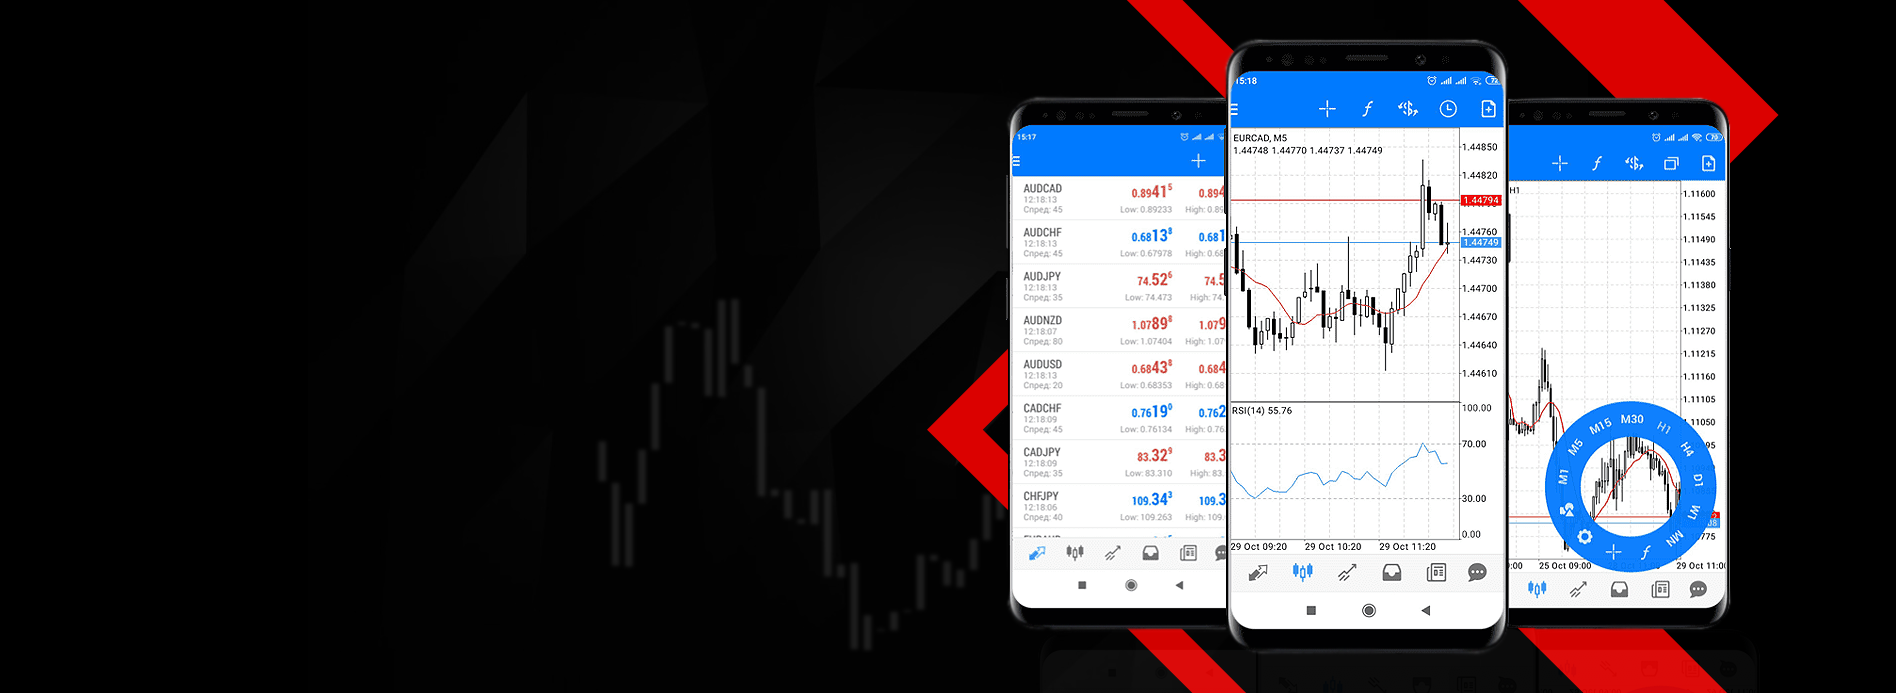
Most Powerful Forex Trading Platform
Meta Trader 4
MetaTrader 4 is highly regarded, most popular trading platform worldwide.
Meta Trader 5
Meta Trader 5 is an advanced trading platform for enhanced trading experience.
MARKET ANALYSIS & EDUCATION

Beginner Course
Learn all the basic concept of Forex Trading and step up your trading career with XtreamForex Beginners Course.

Show Latest News
GBP/USD Stays Above 1.2500 Ahead of Tuesday’s UK Labor Data During Monday’s Asian trading session, the GBP/USD...

Risk Management
Learn all the strategies and Tips of Risk Management that you need to power up your Trading Career.


Beginner Course

Show Latest News

Risk Management

Latest Webinar
OUR AWARDS

Best Customer
Support Broker
Best
MT4 & MT5
Best Affiliate
Program

Best Customer
Support Broker

Best Forex Broker
Asia & Europe

Best Global
Forex Broker

Best Online
Broker in Asia

Best Client
Experience Broker

Most Popular
Forex Broker